
Two month ago, I started my PhD and the first assignment I got was to optimize the performance of an R package called DESeq2.
In another blog post, I will describe in more detail about the success of that, but here I want to focus on the tools that helped me to navigate DESeq’s complex code base and identify the slow spots.
For those not familiar with Bioinformatics and RNA-seq differential expression analysis, DESeq2 is one of the most popular tools for this task with more than 20,000 downloads each month. It has more than 5,000 lines of R code and another 400 lines of C++ code using Rcpp. For an R package, it is definitely one of the more complex projects.
debugonce()
The first challenge was to understand how DESeq2 works. Basically, how it goes from a count matrix to a table with p-values. The two most helpful tools in R for this task are debugonce() and browser() which both start the R debugger.
They work slightly differently: the browser() statement is inserted into the source code and will trigger the debugger when it is executed. In contrast, debugonce() is called from the console with the name of the function that you want to debug. For example:
# estimateDispersionsGeneEst is the function, I suspected, is problematic
debugonce(estimateDispersionsGeneEst)
# Now, when the function is called
# and you will land in the debugger.
# dds is an object I created before
estimateDispersionsGeneEst(dds)
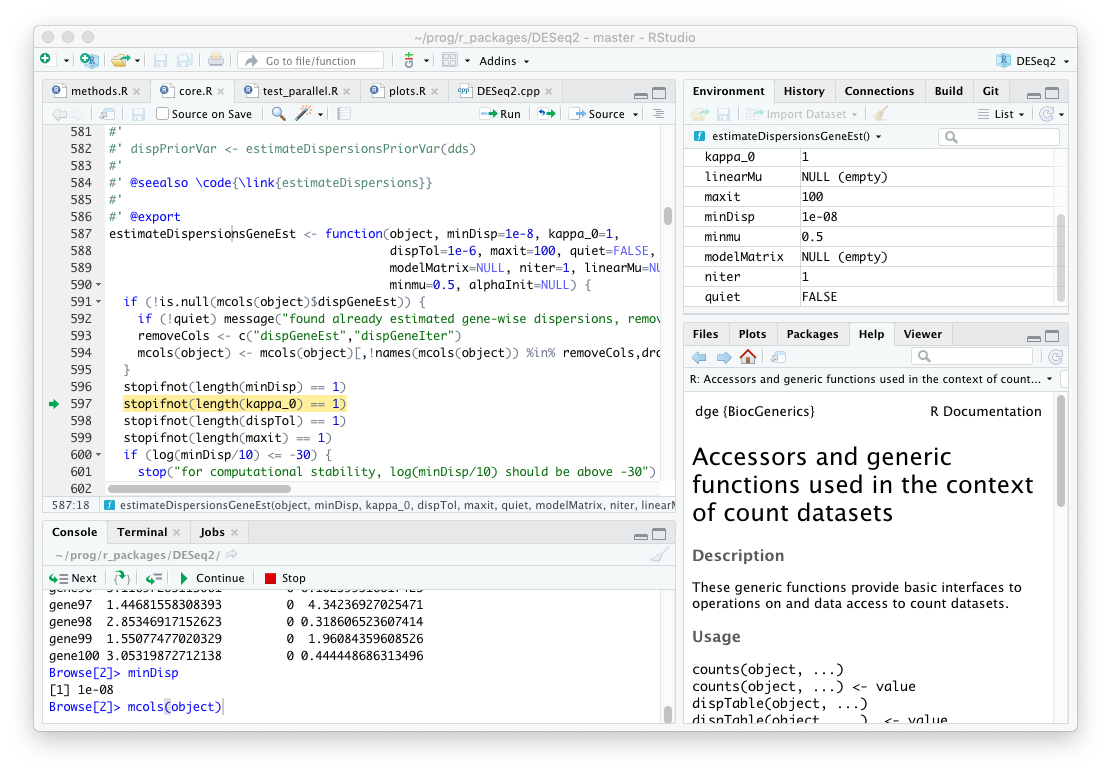
The R debugger inside RStudio. The best tool to explore a new code base. It allows you to step through the function calls and inspect the intermediate values for each variable.
profvis
profvis is a profiler for R. A profiler reports how much time a function spends on each statement. This is invaluable, because in the words of Martin Fowler:
Trying to deduce where the program will spend its time is also futile. I know plenty of experienced programmers who always get this wrong. You have to use a profiler.
- Martin Fowler1
profvis is pretty straight forward to use: you wrap the statement of interested inside the profvis() call
library(profvis)
profvis({
  estimateDispersionsGeneEst(dds)
})
and you get a nicely rendered overview how much time the program spend on each line of code in that function.
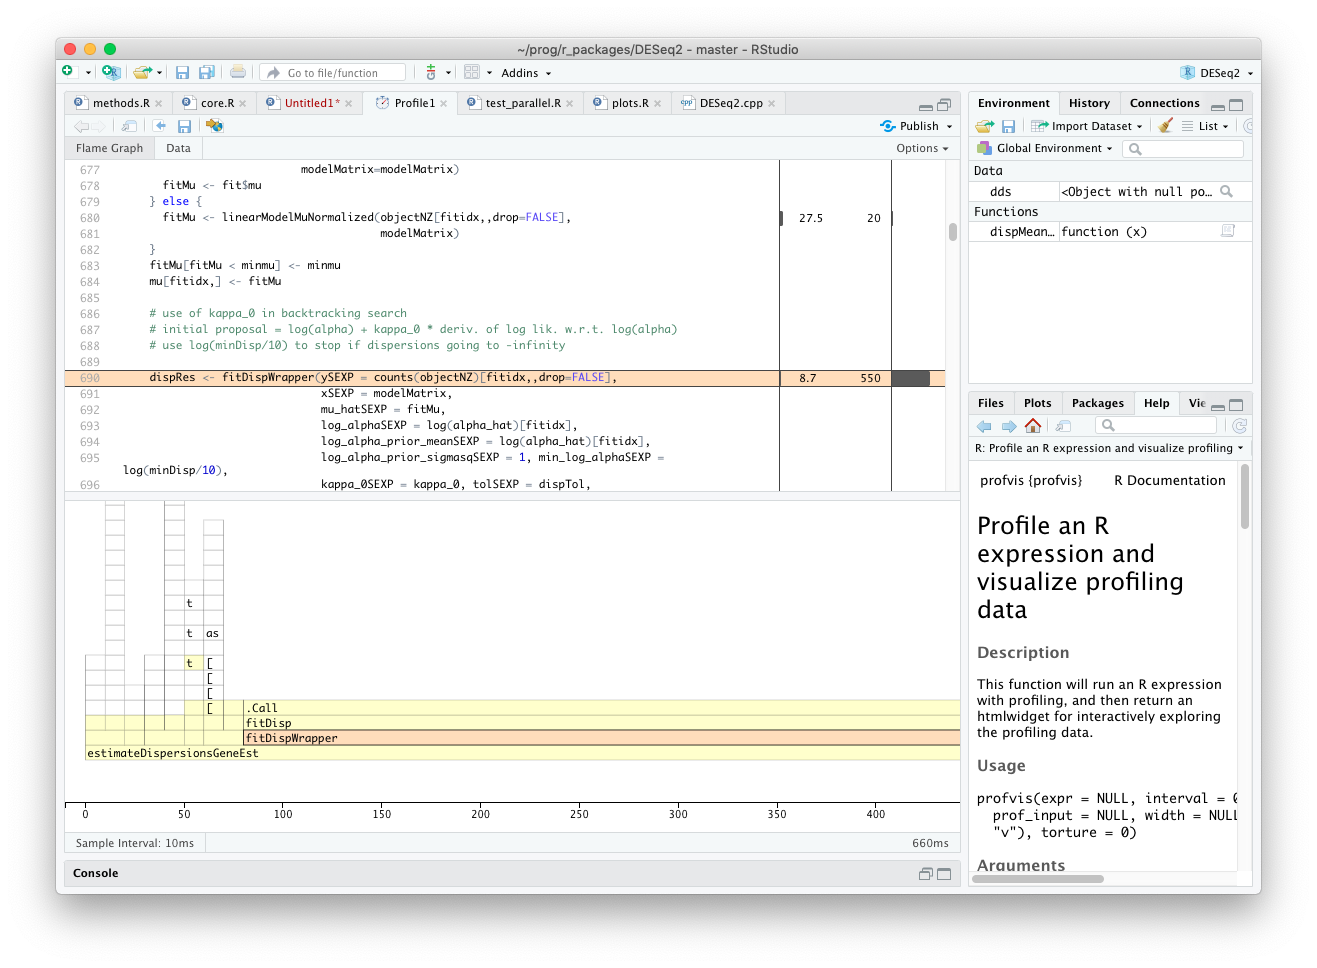
Result from profvis in RStudio. It immediately tells you where the function call spends most time. In this case, the estimateDispersionGeneEst() function spends 85% of the time (550 ms) in the internal C++ function fitDisp() function.
LLDB
In the previous step, we found out that the estimateDispersionGeneEst() function spends most of the time not in R code, but in a native function. This is because the authors of DESeq2 have already put some effort into making the package fast.
Unfortunately, it is more challenging to debug C++ than R code. We know that most time is spend in the fitDisp() function (C++ source on GitHub), but we cannot call debugonce(fitDisp) because it is native code.
Fortunately, people in the C / C++ world have faced the same problems and developed tools, to step through C++ code. One of the tools developed for this challenge is LLDB. However, we cannot use LLDB from within RStudio, we will have to run R from the terminal. (The following should work on Linux and Mac; if you use Windows, you are probably out of luck.)
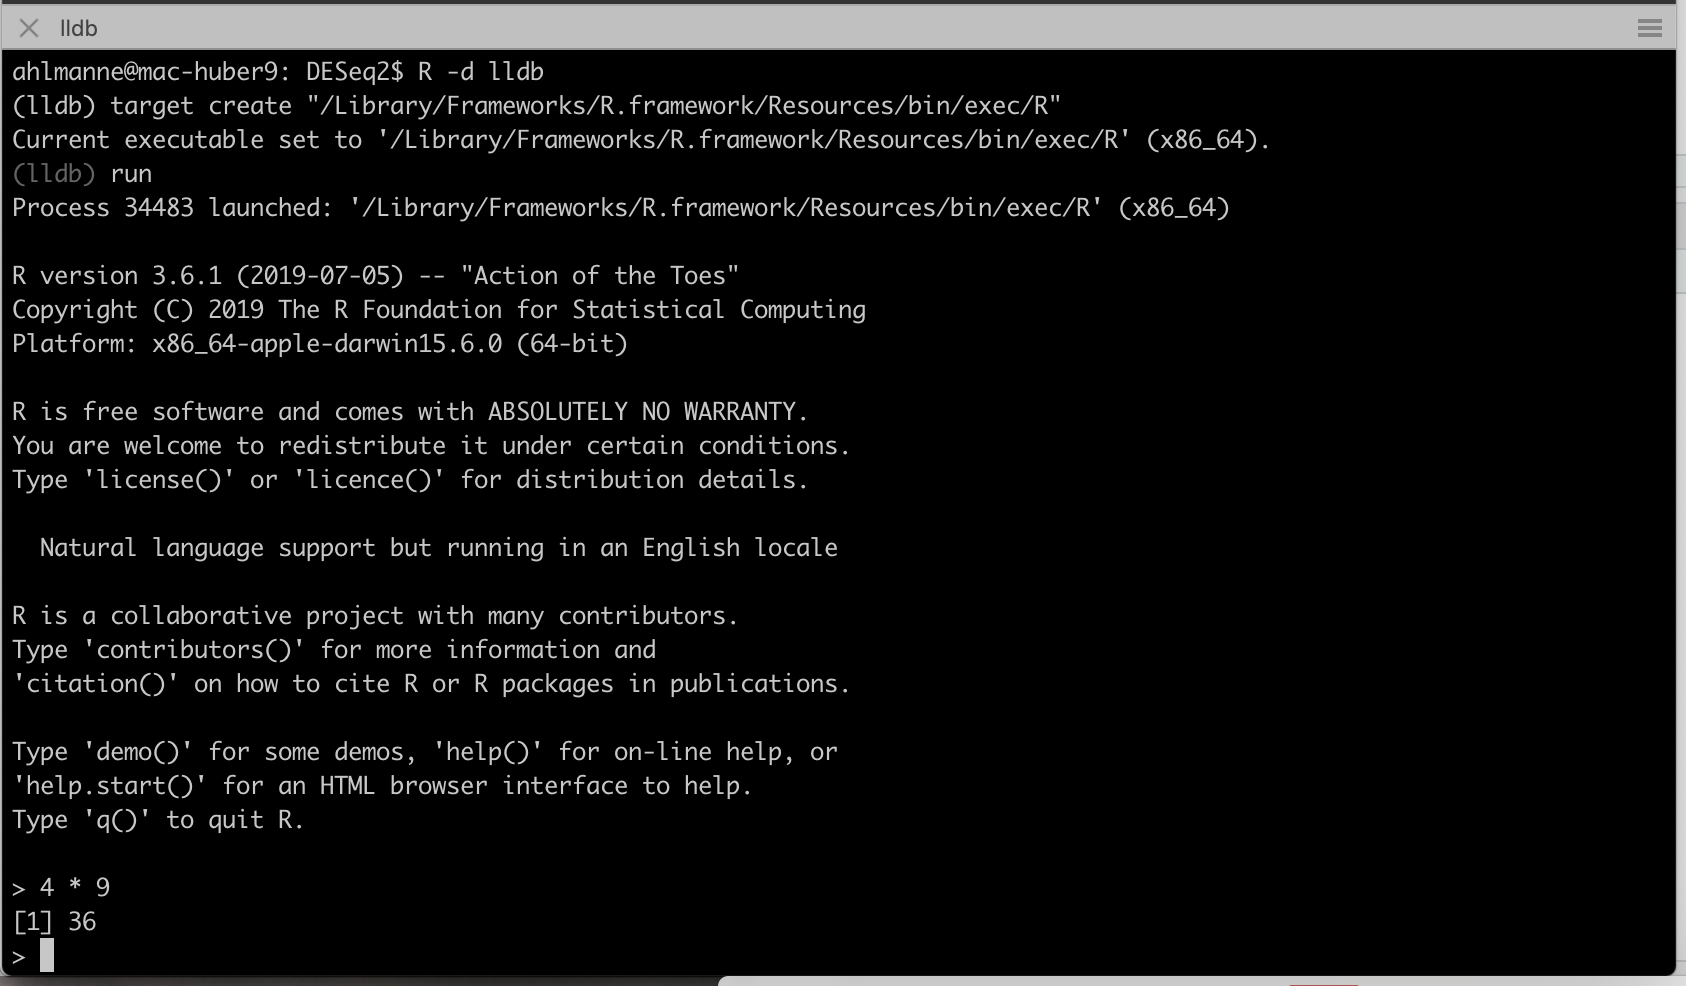
~$ R -d lldb
The -d lldb flag tells R that we want to debug code and you will notice that the interface looks different from the standard R console. It first starts the lldb console. To actually get to the R console, you have to type run in the lldb console (see screenshot). To go back to the lldb console from the R console, you have to send an interrupt signal (Ctrl + C). To go back to R, type continue into the lldb console.
To set a breakpoint for a C++ function in some R package, first make sure to load the package in the R console (e.g. library(DESeq2)). Then, go back to the lldb console and call
(lldb) breakpoint set --name fitDisp
# Breakpoint 3: where = DESeq2.so`fitDisp(SEXPREC*, SEXPREC*, SEXPREC*, SEXPREC*, SEXPREC*,
#   SEXPREC*, SEXPREC*, SEXPREC*, SEXPREC*, SEXPREC*, SEXPREC*, SEXPREC*, SEXPREC*), address = 0x00000001287ac480
If setting the breakpoint was successful, go back to R by typing continue. If you now call estimateDispersionsGeneEst(dds), you will enter the debugging mode and can go step by step through the C++ function.
CXXFLAGS=-g -O0 flag to the ~/.R/Makevars file and recompile the package. Remember to change it back, after you are done. Otherwise all packages you install will run slower than necessary.
Instruments
LLDB is useful for understanding the typical code path in C++, but it can still be challenging to identify which statements are actually slow. What we need is a profiler for native code. Fortunately, there is already one included in the XCode development tools for Mac called Instruments and more specifically the Time profiler.
Instruments is a versatile tool, because it can be attached to any process on the computer. We will again run R from the console (without the debugger), record the session from within Instruments, and execute the R code we want to profile. Instruments automatically tells you in which part of the call stack the method spends most of its time. By double clicking on the fitDisp() function, it can also show us the C++ source code with the time the program spent on each line.
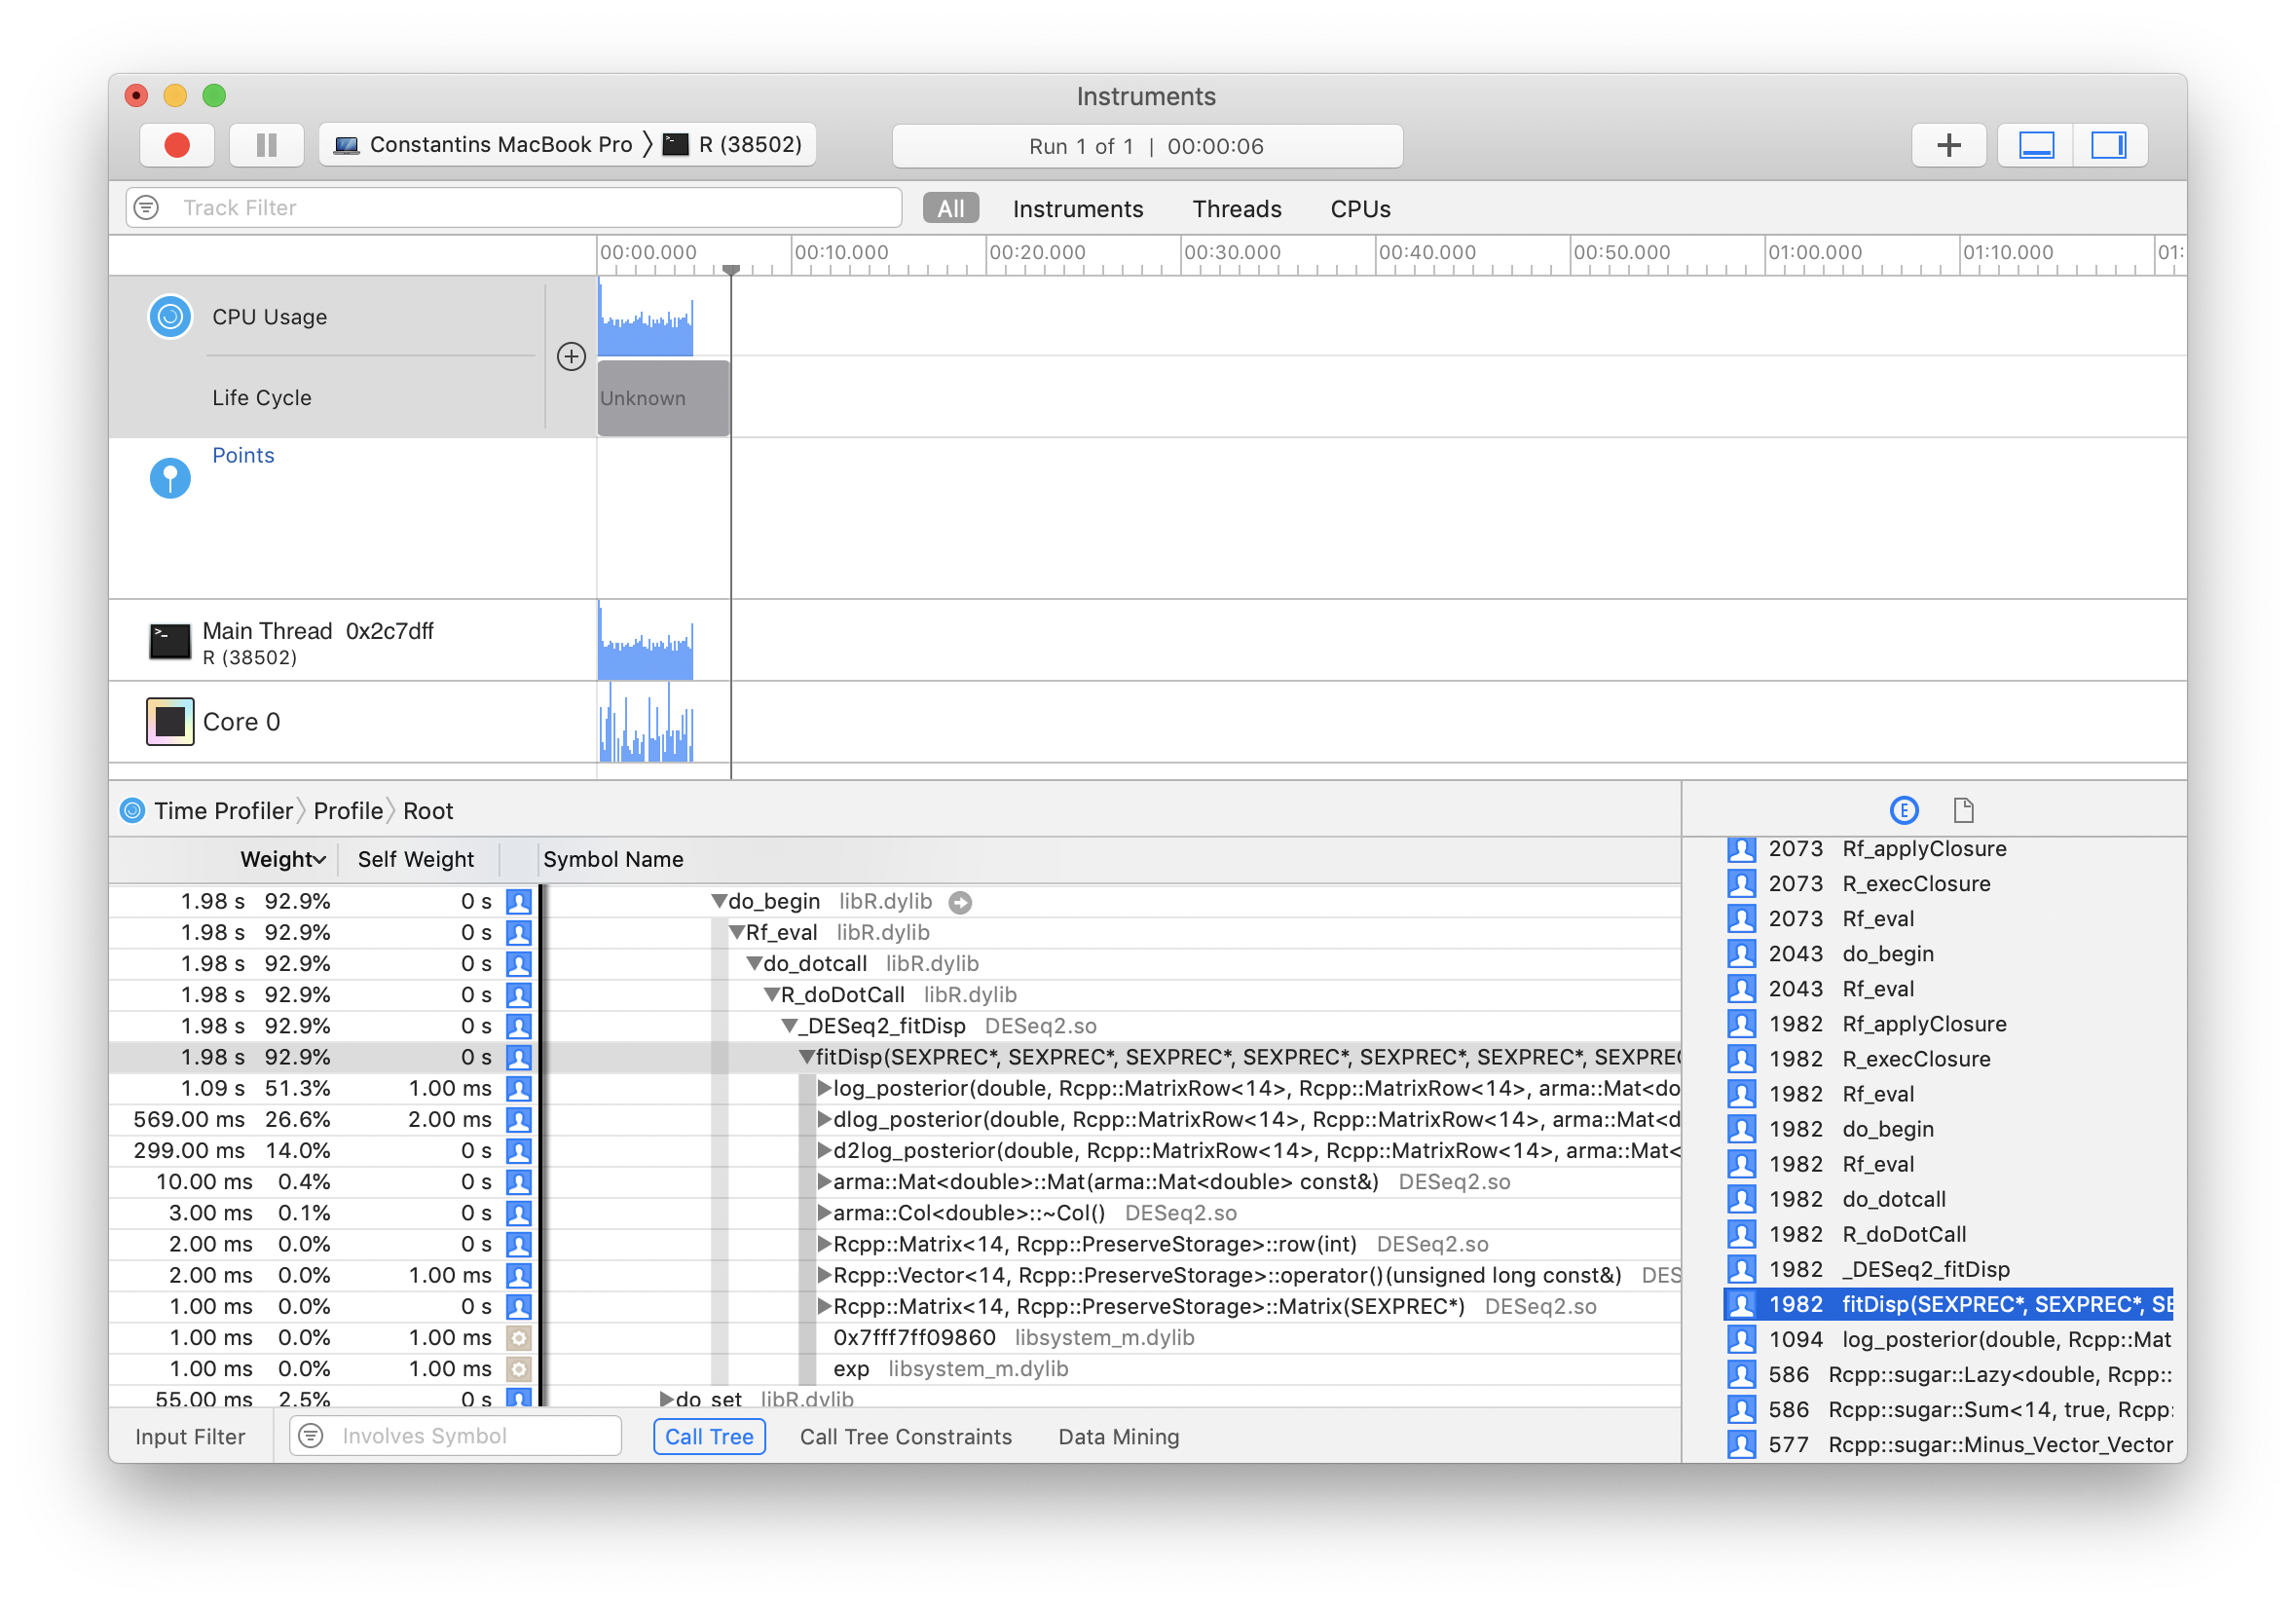
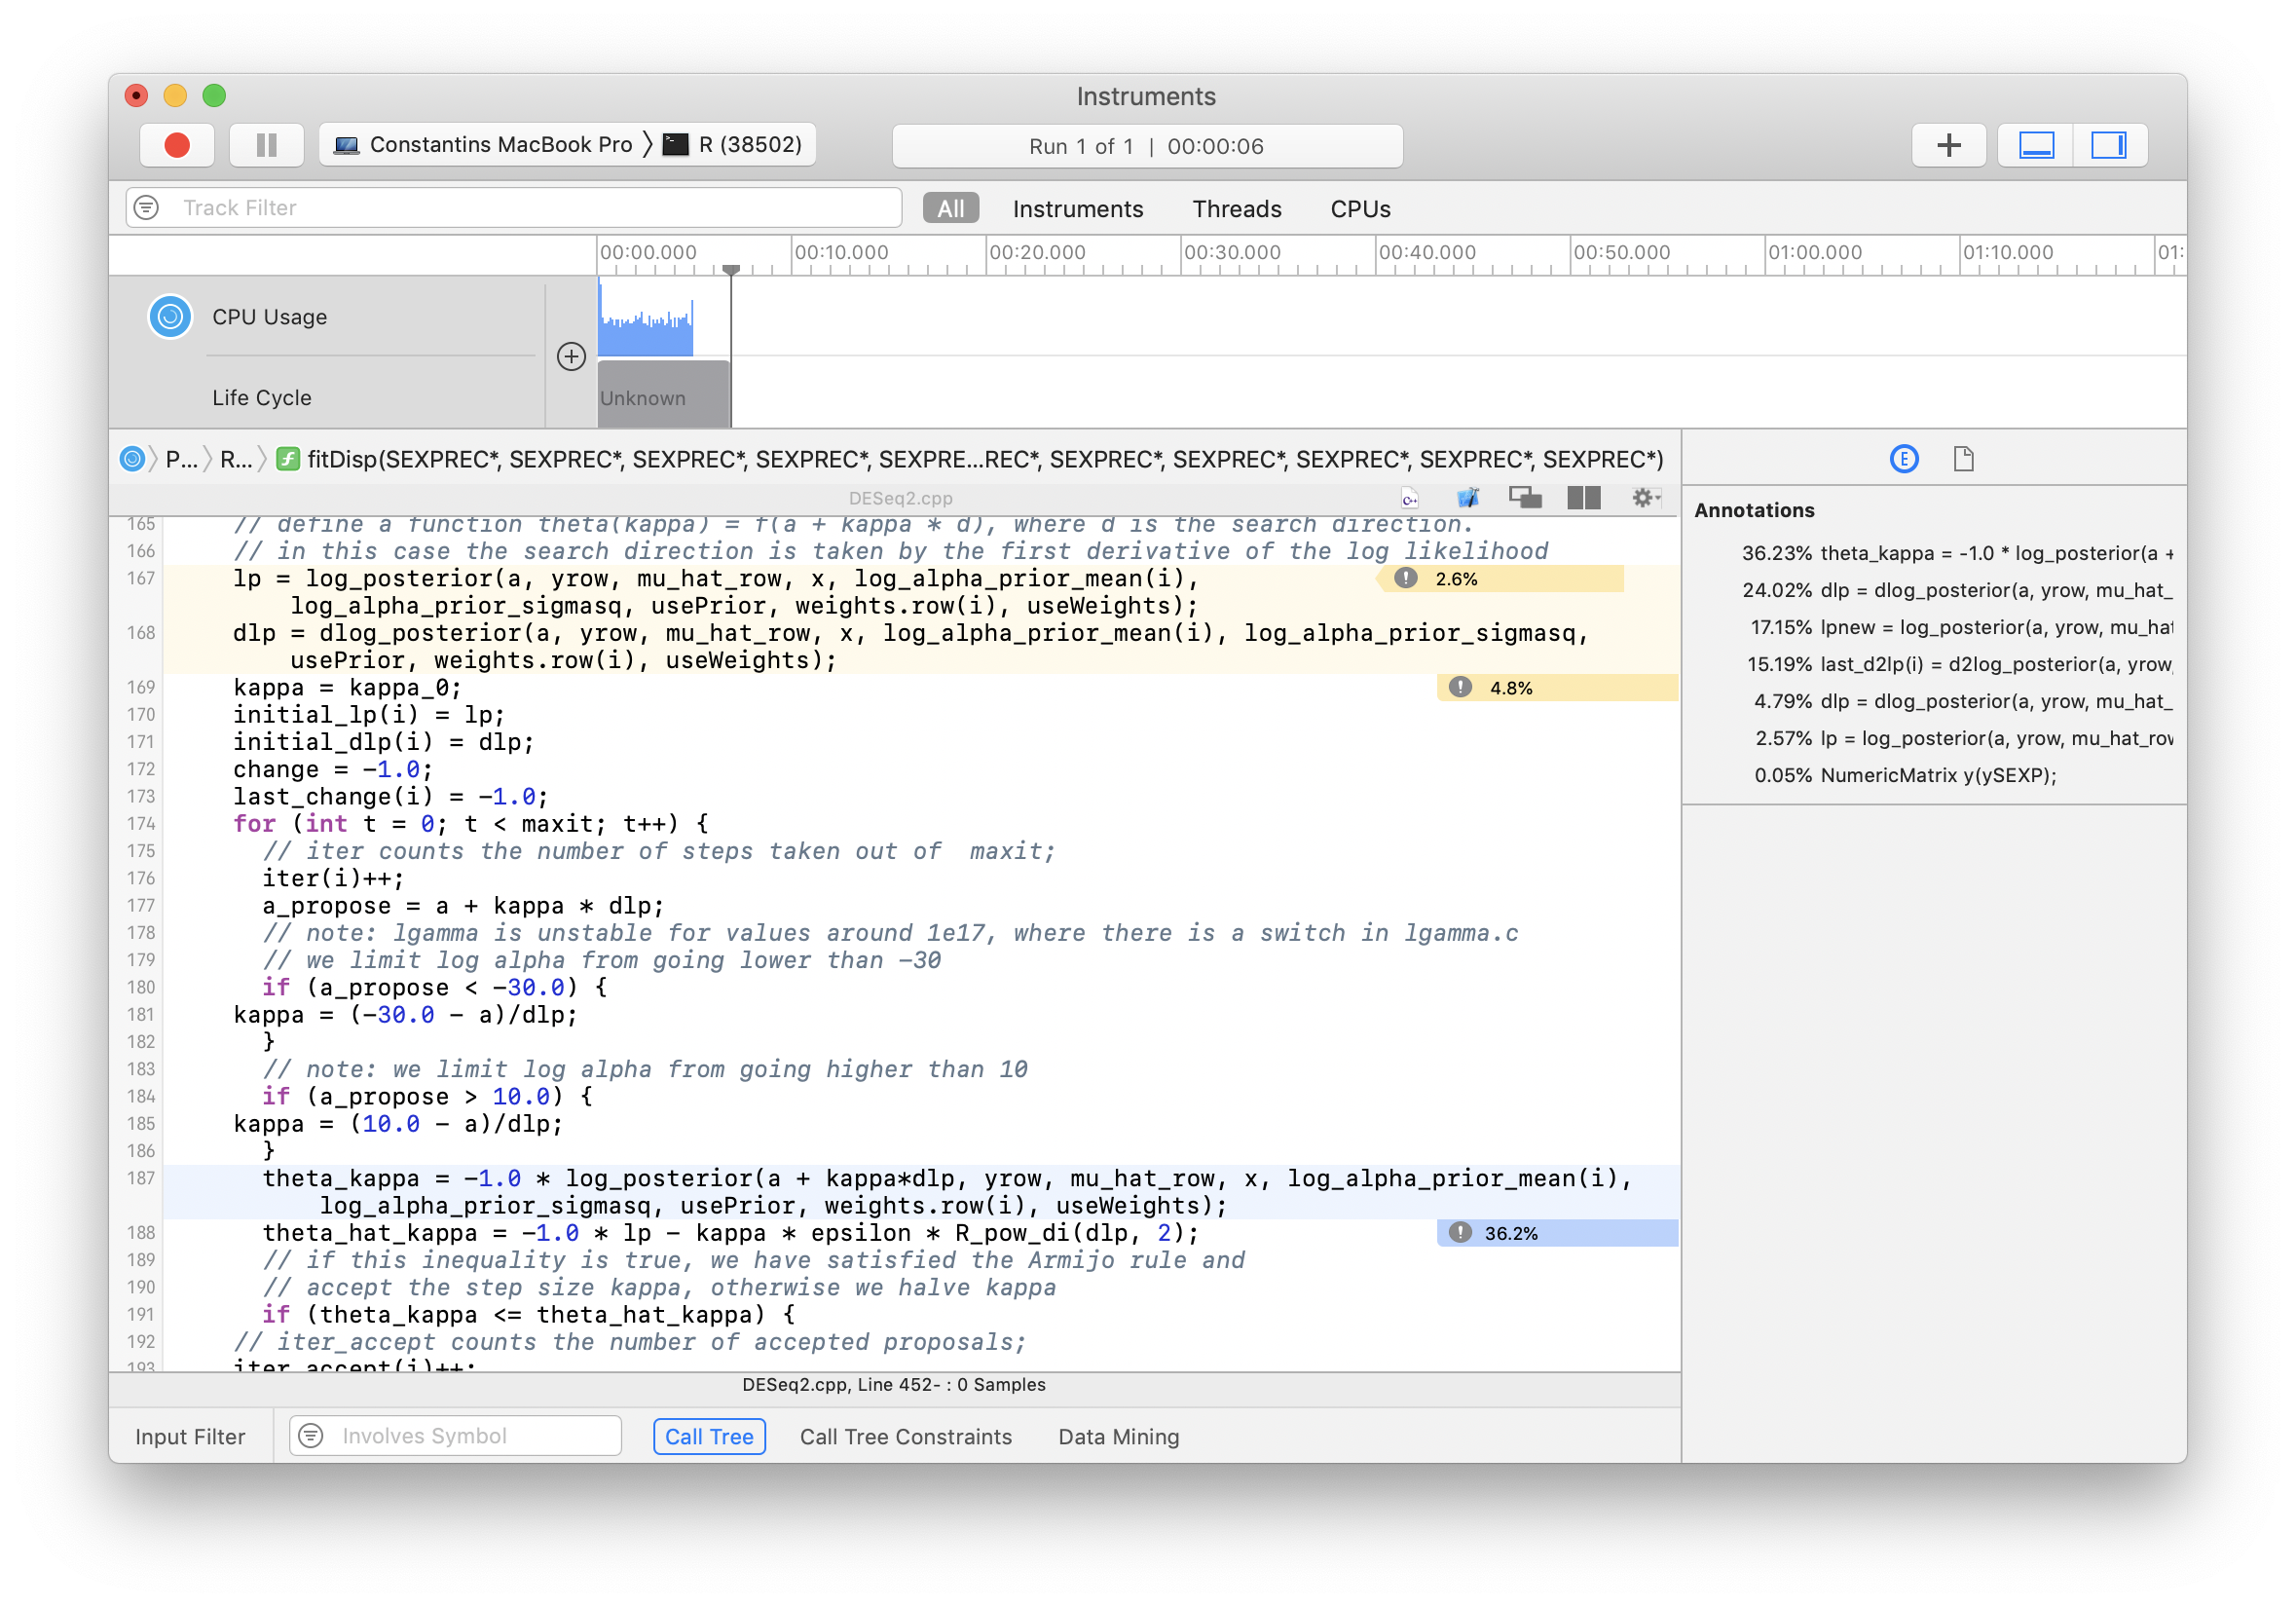
Instruments’ Time profiler on Mac OS. It points us directly to the problematic lines in the Rcpp code.
Conclusion
In summary, I presented four tools:
| Tool | Language | |
|---|---|---|
debugonce() |
R | Swiss-army knife to explore unknown R code base |
profvis() |
R | Beautiful profiler, that clearly tells you where your code is slow |
R -d lldb |
C++ | The best way to step through C++ code underlying an R package |
Instruments |
C++ | Easy to use profiler for native code that can help you find out where C++ spends its time |
I hope with those four tools, you are well equipped to profile a package you care about and identify its performance bottlenecks.
Addendum (18th of January 2020):
I recently came across this article by Russel et al. (2019) on good software engineering practices for research software. It discusses best practices about performance optimization and in their supplementary materials on Github contains a similar tutorial on how to profile R that contains C++ code.
- Martin Fowler, Yet Another Optimization Article. https://www.martinfowler.com/ieeeSoftware/yetOptimization.pdf ^